Case Study: Speeding Up a Next.js Site, Before and After
A first-hand case study of this website: what I measured, what I removed, the numbers before and after, and what is still not good enough.

Why this case study
This article documents how I worked to speed up a Next.js site: this one, essadikine.com, a bilingual Next.js 16 portfolio built with the App Router, TypeScript and Tailwind. It gives the real numbers before and after, the decisions behind them and the limits of the measurements. Nothing here is a projection: every figure comes from my own measurement log.
The site was already pre-rendered and reasonably fast to look at, but it shipped far too much JavaScript for what it does. On a mid-range phone, that JavaScript is what makes a page feel stuck after it appears.
Method
- Tool: Lighthouse 12, run locally in headless Chrome with mobile emulation and simulated 4G throttling, against the live site. PageSpeed Insights was the first choice, but its API returned HTTP 429 (rate limited, no API key yet), so the local run became the reference.
- Pages: six representative URLs, the same ones used later in Lighthouse CI: home (EN and FR), a profile page, the portfolio, a project page and an article.
- Metrics: performance score, Largest Contentful Paint (LCP), Total Blocking Time (TBT), Cumulative Layout Shift (CLS) and JS, the compressed transfer size of all script requests, first-party and third-party.
- Dates: the baseline was measured on 2 November 2026, the last run on 6 November 2026.
These are lab measurements, not field data from real visitors. Keep that in mind when reading every table below.
The starting point (2 November 2026)
| URL | Score | LCP | TBT | JS |
|---|---|---|---|---|
| / | 83 | 3.1 s | 430 ms | 588 KB |
| /fr | 85 | 2.9 s | 370 ms | 588 KB |
| /full-stack-developer | 67 | 5.3 s | 430 ms | 588 KB |
| /portfolio | 63 | 5.8 s | 500 ms | 597 KB |
| /portfolio/dna-studio-data-ai-platform | 70 | 3.2 s | 930 ms | 597 KB |
| /blog/build-rag-assistant-company-documents | 73 | 3.2 s | 810 ms | 597 KB |
CLS was already 0 (0.007 on the article). The problem was clear: close to 600 KB of compressed JavaScript on every page of a mostly static site, and blocking time up to 930 ms.
What I changed, and why
1. Removed framer-motion entirely
Animation library code was still imported in a dozen files (portfolio filter, gallery, skills, contact, image modal). After a design reset that dropped decorative effects, no import was left, so the dependency was removed from the project. Reveal effects now use CSS transitions and a small IntersectionObserver component.
2. Server components by default
Hero, footer, section headers and cards became server components that receive their text as props. Only interactive leaves stay client components: theme toggle, language switcher, mobile menu, filters, forms and the assistant. The global translation provider was removed, so the full dictionary is no longer sent to the browser. First-party JavaScript went from about 50 KB to about 25 KB gzip per page with this change alone.
3. Third parties only when they are needed
GA4 and Clarity load only after consent, and only after the page load event and an idle moment. Without consent, no Google script loads at all. The Turnstile anti-spam script loads only on pages with a form, and the assistant widget loads on first click.
4. Link prefetch turned off
This was the surprise. Next.js prefetches links in the viewport by default. On the home page, that meant 24 background requests (146 KB) and the code of other routes, including the zod validation library (52 KB gzip), downloaded on every load, on mobile too. The site's link wrapper now disables it by default:
export default function LocaleLink({ href, prefetch = false, ...rest }: ComponentProps<typeof Link>) {
  const params = useParams<{ lang?: string }>();
  const lang = params?.lang;
  const locale = isLocale(lang) ? lang : defaultLocale;
  const localized = typeof href === "string" ? localizePath(href, locale) : href;
  return <Link href={localized} prefetch={prefetch} {...rest} />;
}
A link where instant navigation is worth the cost can still pass prefetch={true}. On a site where each page is static, a click that fetches the next page on demand loses very little.
5. Kept pages static, including with a strict CSP
Pages are statically generated and revalidated every hour, and no public page is forced to render dynamically. When I added a Content-Security-Policy, the nonce-based version would have forced every page to render on each request. I chose the documented CSP without nonces instead (no unsafe-eval in production, frame-ancestors 'none', an allow-list of the third parties actually used) to keep the static pages and their speed.
6. Smaller details
Two font families only (Inter and Sora, with display swap), the monospace font dropped in favour of the system stack, and every image in a fixed 4:3 box so CLS stays at 0.
The path was not linear
The numbers did not improve in a straight line, and the dips are worth showing.
| Step | Scores (6 URLs) | TBT | JS |
|---|---|---|---|
| Before (2 Nov) | 63 to 85 | 370 to 930 ms | 588 to 597 KB |
| After phase 1 (2 Nov) | 54 to 66 | 960 to 2,390 ms | 392 to 468 KB |
| After phase 2 (2 Nov) | 75 to 91 | 170 to 600 ms | 239 to 246 KB |
| After phase 4 (3 Nov) | 81 to 91 | 230 to 510 ms | 253 to 260 KB |
| After the prefetch fix (6 Nov) | 83 to 93 | 60 to 100 ms | 180 to 181 KB |
After phase 1, JavaScript had already dropped by about 190 KB per page, yet scores fell. Part of it was the measurement: Lighthouse simulates CPU speed from the host, and two builds were running on the same laptop. Part of it was real: a reveal component read the layout for every block, and a back-to-top button had an unthrottled scroll handler. Both were fixed, and the next run on an idle machine was much better. After phase 4, JavaScript grew slightly because it now included about 15 KB for the cookieless Cloudflare beacon and the analytics loader.
Before and after, page by page
| URL | Score | TBT | JS | LCP |
|---|---|---|---|---|
| / | 83 to 86 | 430 to 60 ms | 588 to 181 KB | 3.1 to 4.1 s |
| /fr | 85 to 86 | 370 to 60 ms | 588 to 181 KB | 2.9 to 4.0 s |
| /full-stack-developer | 67 to 89 | 430 to 60 ms | 588 to 181 KB | 5.3 to 3.6 s |
| /portfolio | 63 to 86 | 500 to 60 ms | 597 to 181 KB | 5.8 to 3.8 s |
| /portfolio/dna-studio-data-ai-platform | 70 to 83 | 930 to 70 ms | 597 to 180 KB | 3.2 to 4.4 s |
| /blog/build-rag-assistant-company-documents | 73 to 93 | 810 to 100 ms | 597 to 181 KB | 3.2 to 3.1 s |
JavaScript fell by about 70% on every page and blocking time by a factor of six to thirteen. Scores improved everywhere, but only the article page reaches 90.
Limits, stated honestly
- Run-to-run variance is large. On 3 November the article page scored 65, 84 and 83 on three consecutive runs. A single Lighthouse score is a noisy signal; the tables keep a typical run.
- LCP is not under 2.5 s. On 6 November it read 3.1 to 4.4 s, higher than the 2.8 to 3.0 s measured on 3 November, with a server response time (TTFB) between 470 and 1,220 ms on that connection. Lighthouse CI on its own runner shows LCP of 2.6 to 3.1 s after the prefetch fix and 2.6 to 3.4 s before, so the fix did not cause a regression, but the reason for the higher live reading is not established.
- The CDN cache is not active yet. HTML and optimised images still miss the Cloudflare edge cache (cf-cache-status: DYNAMIC). Caching them at the edge is the next and probably largest lever for LCP.
- The JavaScript budget is barely met. The target was 180 KB; pages sit at 180 to 181 KB, and most of what remains is Next.js and React framework code.
- Lab, not field. Real-user Core Web Vitals will be checked in the Chrome UX Report once the site has enough traffic.
What you can apply to your own Next.js site
- Measure first, on the same pages, with the same tool, on an idle machine, and run each page more than once.
- Count JavaScript per page, first-party and third-party, before optimising anything else.
- Remove animation libraries where CSS transitions do the job.
- Push client components to the leaves: a page should not become a client component because one button is interactive.
- Load analytics after consent and after load.
- Check what prefetching downloads in the network panel; turn it off where it costs more than it saves.
- Protect static rendering: be careful with features that force dynamic rendering, such as nonce-based CSP.
- Cache at the edge once the page itself is light.
Conclusion
Speeding up this Next.js site was mostly about removing things: an animation library, client-side translation data, eager third-party scripts and automatic prefetching. JavaScript went from about 588 KB to 181 KB per page and blocking time from up to 930 ms to 100 ms or less. LCP still needs work, and the edge cache is the next step.
For the search side of the same site, read SEO, GEO and AEO for a Next.js website. The project itself is described in the essadikine.com case study, and if you want the same approach for your business, see the Next.js web development service.
- Next.js
- Performance
- Lighthouse
- Core Web Vitals
- JavaScript
- Case study
Share this article

About the author
Anass Essadikine
Data & AI Engineer and Software Engineer based in Casablanca, Morocco. I build data platforms, Power BI dashboards, RAG assistants and Next.js / Spring Boot applications.
Related projects
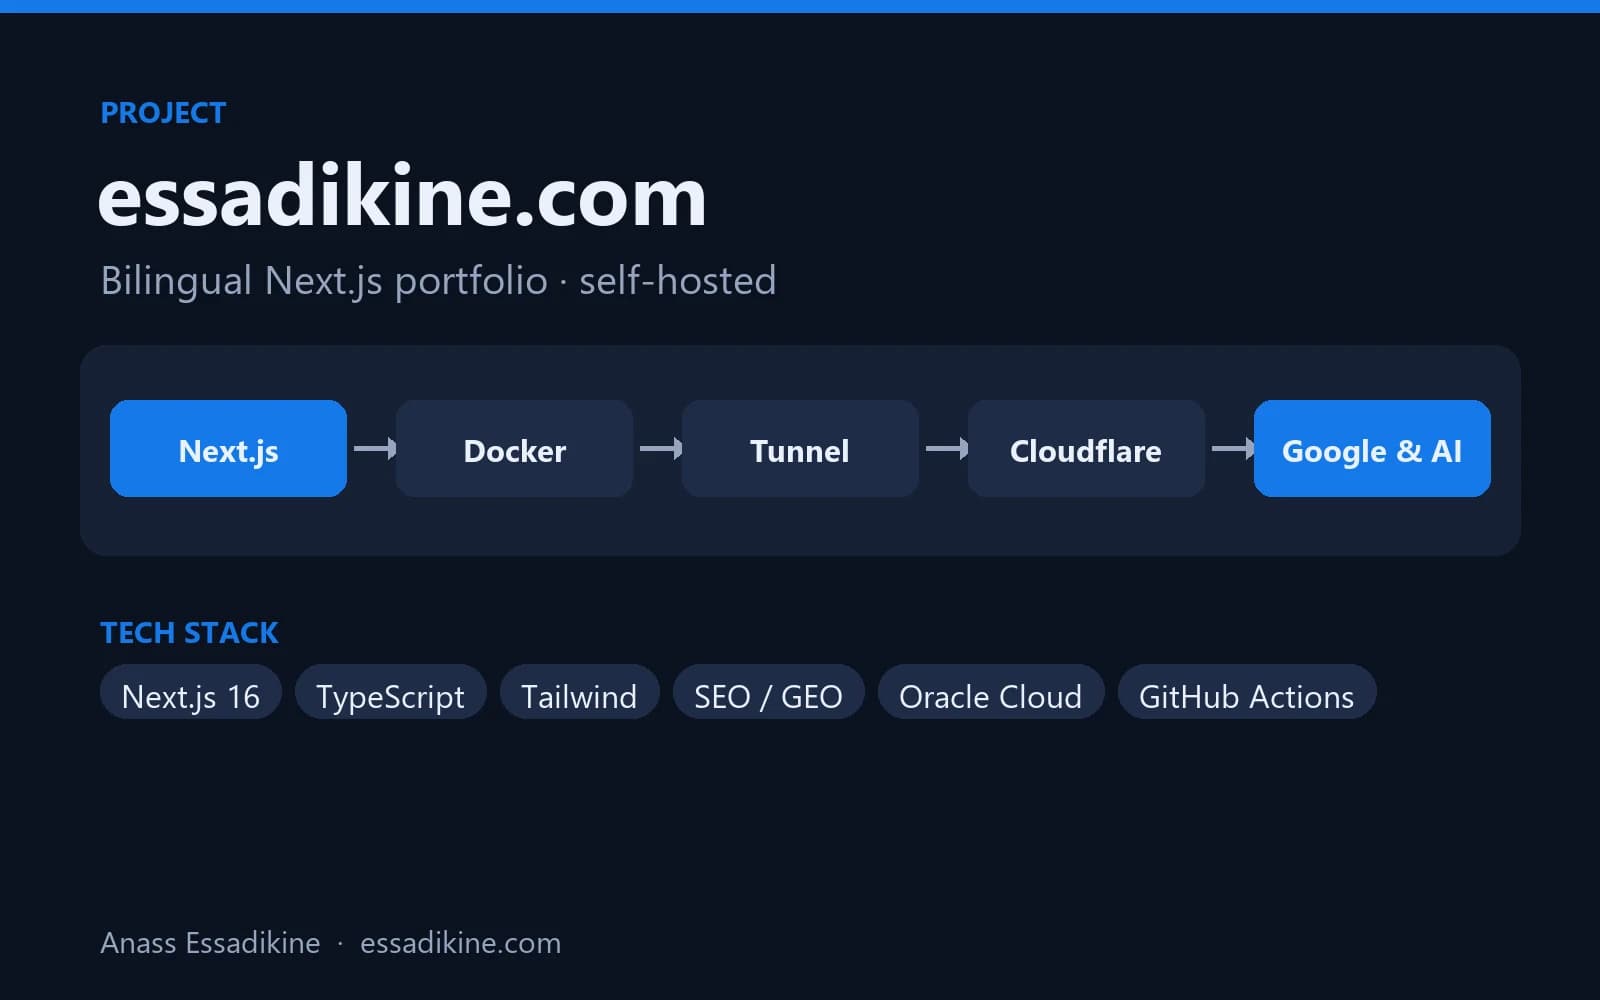
essadikine.com: Bilingual Next.js Portfolio
This website: a fast, bilingual (EN/FR) portfolio optimised for Google and AI answer engines, self-hosted with Docker behind Cloudflare.
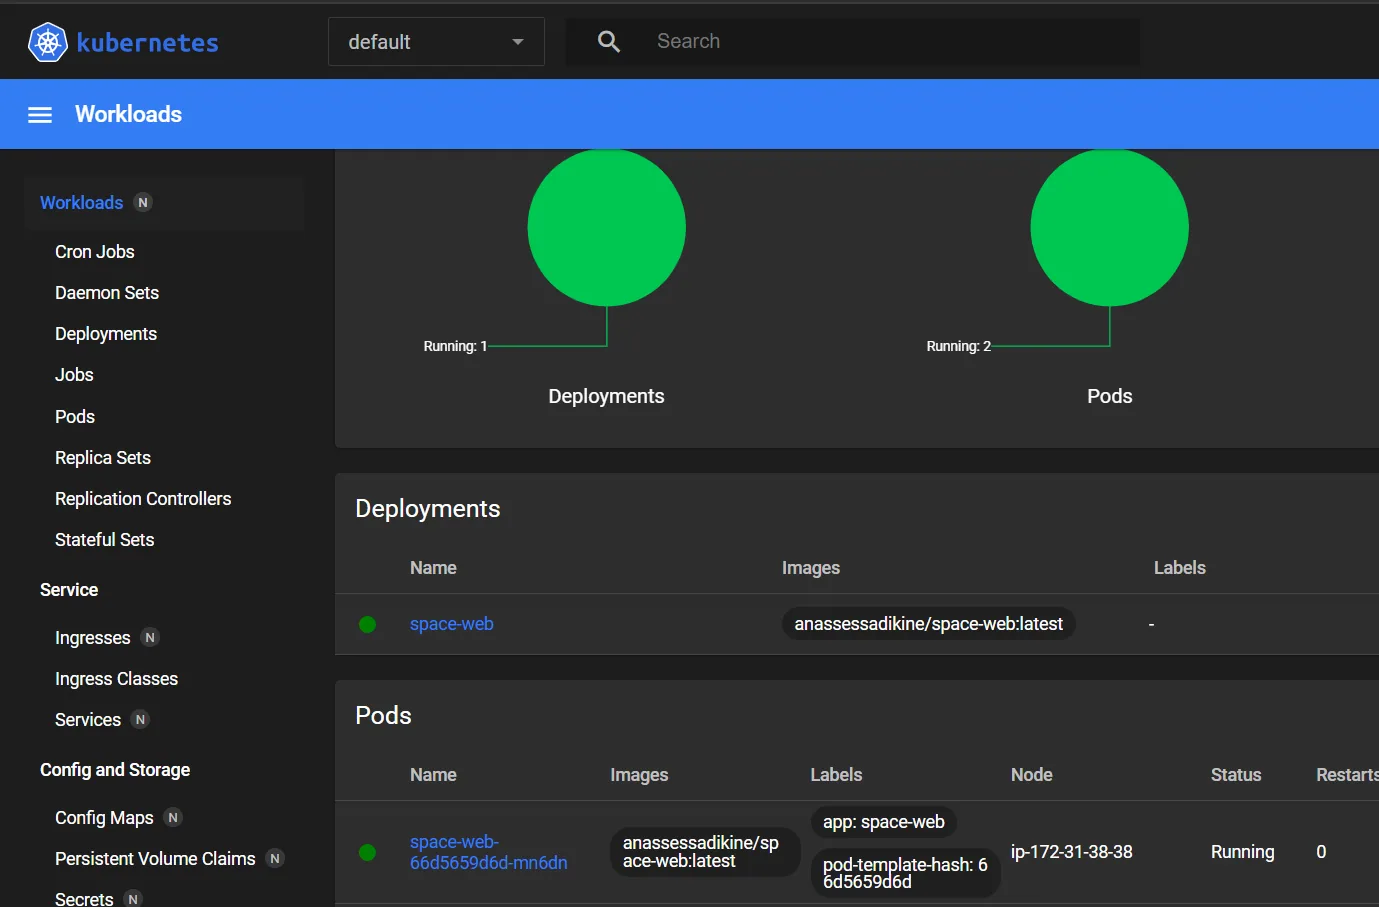
Cloud Deployment with Automated CI/CD
An end-to-end pipeline that builds, containerises and deploys a React app to Kubernetes on AWS on every push.
Frequently asked questions
Removing JavaScript. Dropping framer-motion, moving to server components and removing the client-side translation provider cut most of the bundle, and turning off link prefetch removed 24 background requests on the home page. Together they took JS from about 588 KB to 181 KB per page.
HTML and images are not yet cached at the Cloudflare edge, and the server response time measured 470 to 1,220 ms on the test connection. The page itself is lighter, so the next lever is edge caching rather than more code changes.
Check first what it downloads. On this site, viewport prefetching loaded 146 KB and other routes' code on every home page visit. For a mostly static site, on-demand loading on click costs little; for an app with frequent navigation, prefetching selected links can still be worth it.
In Next.js, a nonce has to be generated per request, which forces every page to render dynamically. That would undo static generation and its speed. A strict CSP without nonces, with an allow-list and no unsafe-eval in production, kept the pages static.
Useful for trends, noisy for single values. On this site, the same page scored 65, 84 and 83 on three runs. Run each page several times on an idle machine, compare the same pages over time, and confirm with field data when traffic allows.