Business Intelligence Data Analyst Career Path: What I Actually Learned Building SQL, Python & Tableau Skills
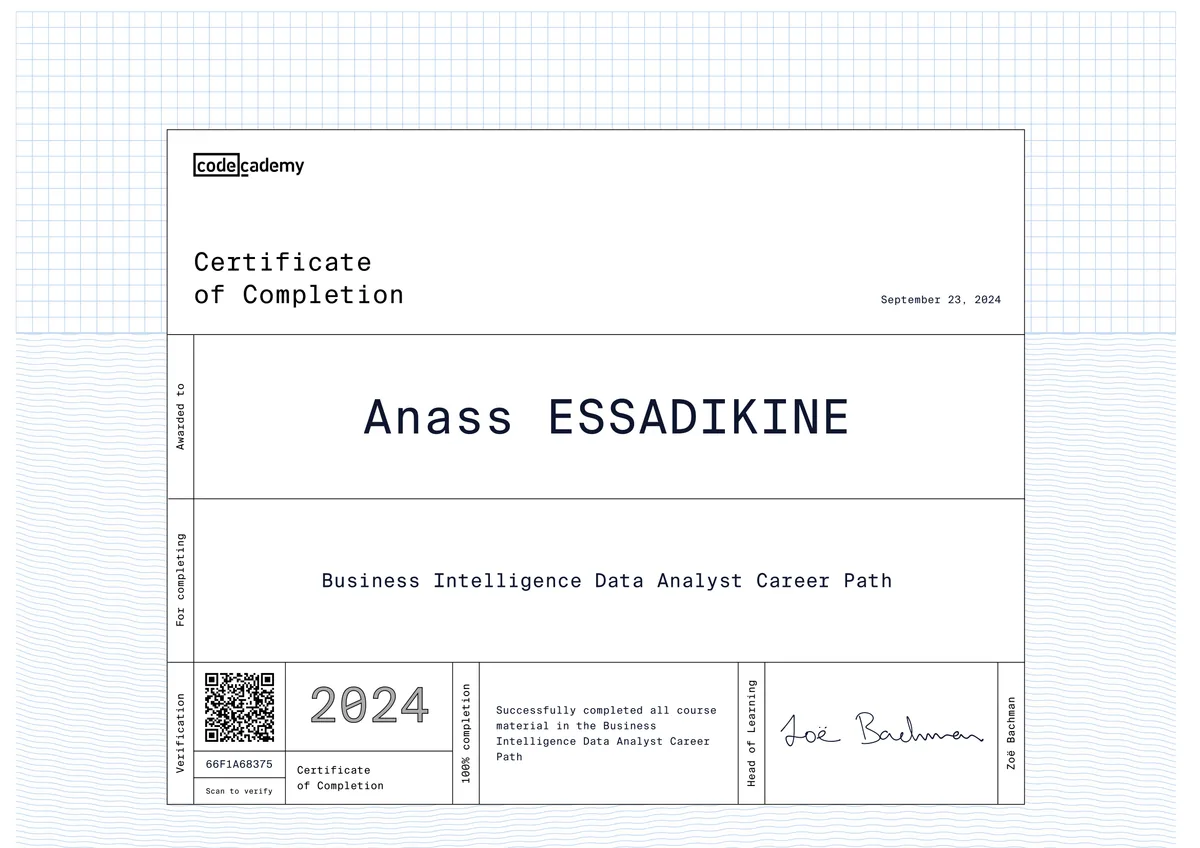
I completed Codecademy's Business Intelligence Data Analyst Career Path, a project-based program (18 units, ~50 hours, 37 hands-on projects) built around one job function that nearly every company now needs regardless of size: someone who can pull data out of a database, clean and analyze it, and turn it into a report or dashboard that a manager can actually act on. That's the BI Data Analyst role — the bridge between raw operational data and business decisions.
The credential matters because the exact skill combination it teaches — SQL, Python, and dashboarding with Excel and Tableau — is the standard toolkit requested in Business Intelligence Analyst job postings across e-commerce, healthcare, logistics, and fintech, not just inside dedicated data-science teams. It's proof I can work with real, messy data end-to-end rather than only in a lab or classroom setting.
What I learned
1Learn SQL
Writing SELECT statements, filtering and aggregating rows, and joining across multiple tables — the core language for pulling business answers directly out of a company's database.
2Python Fundamentals for Data Science (Part I & II)
Core Python syntax, control flow, functions, and data structures, taught through data-science use cases rather than generic software-engineering examples.
3Portfolio Project: U.S. Medical Insurance Costs
A hands-on project analyzing a real insurance dataset with pure Python (no external libraries) to answer concrete business questions about cost drivers.
4Python Pandas for Data Science
Data cleaning, transformation, merging, grouping, and lambda functions using the pandas library — the standard tool for working with tabular datasets in any BI or analytics role.
5Principles of Thinking about Data
Numerical reasoning and statistical thinking: how to frame a business problem as an answerable data question before writing a single query or line of code.
6Dashboards and Reporting with Excel and Tableau
Building clear, decision-ready dashboards and visual reports with the two BI tools most frequently requested in Business Intelligence Analyst job listings.
7BI Data Analyst Final Portfolio Project
A capstone combining data cleaning, exploratory analysis, and visualization into a professional report written for a non-technical stakeholder audience.
Tools & technologies
Applied in my projects
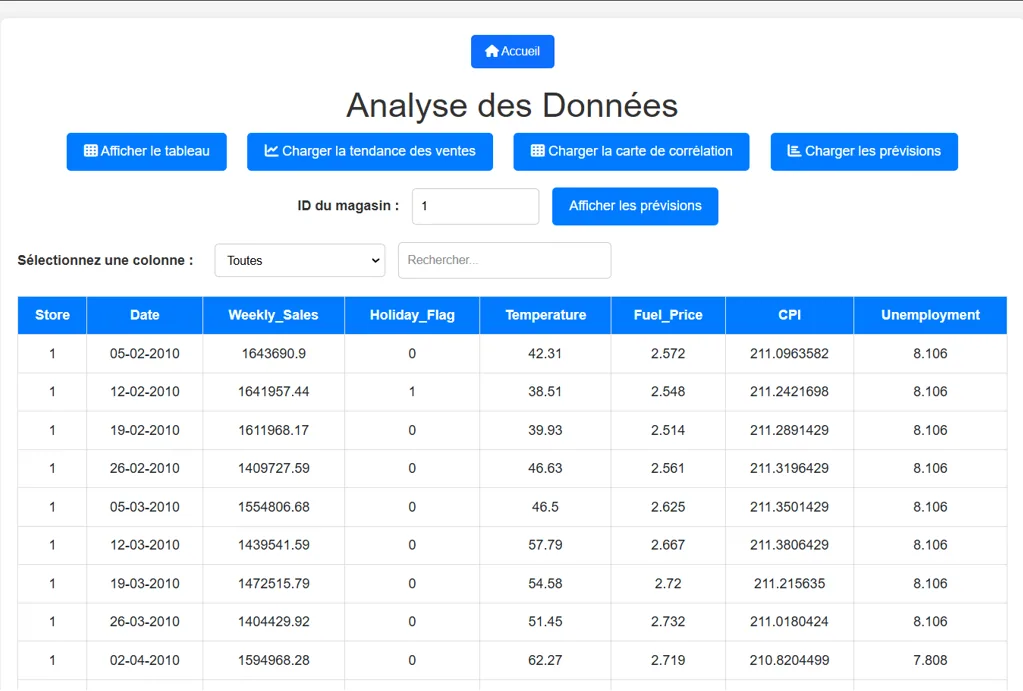
This BI skill set shows up directly in my Sales Prediction App with Django & ML, where I used Python, pandas, NumPy, and Matplotlib/Seaborn to clean sales data, explore trends, and expose predictions through a Django app for business users. It also underpins the data layer of my University Housing Management (FSBM) platform, where I designed and queried the MySQL schema powering student housing, payments, and admin reporting — the same SQL-first thinking this Career Path teaches, applied to a real production system rather than a classroom dataset.
Why this matters for employers
What makes this credential valuable to employers isn't the certificate itself — it's that it forces fluency in the two things every data-driven company runs on: SQL to pull the truth out of a database and Python/pandas to shape that truth into an answer. I write multi-table SQL queries against a production schema, clean and transform datasets with pandas, and package the result into an Excel or Tableau dashboard a non-technical stakeholder can act on without a walkthrough. Paired with my Spring Boot/React/MySQL and Django backend experience, that means I don't just build the system that generates the data — I can query it, analyze it, and report on it too: exactly the "full-stack plus analytics" profile mid-size teams and Moroccan tech employers look for when they can't yet justify a dedicated BI hire.
Verified certificate
Download the official certificate for this achievement.
Related projects
 AI / Data Science2024
Sales Prediction App with Django & ML
A predictive analytics web app that forecasts sales and visualizes results through an interactive interface.
 Web Development2024
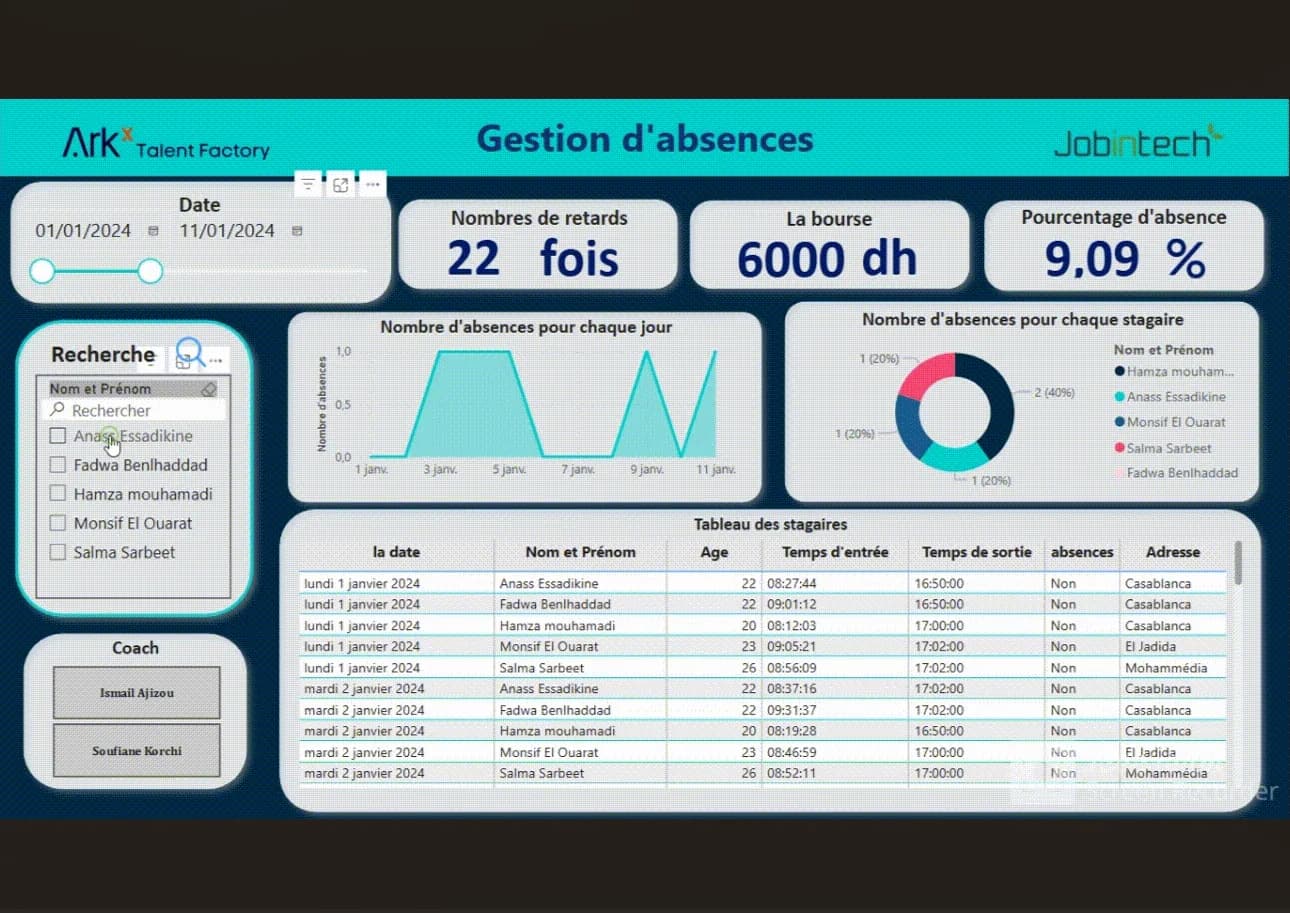
University Housing Management (FSBM)
A secure platform for managing student housing requests, allocations, and payments end-to-end.
Frequently asked questions
It's a beginner-level, project-based Career Path — 18 units, roughly 50 hours, and 37 hands-on projects — covering SQL, Python, and pandas for data analysis plus Excel and Tableau for dashboards and reporting: the core toolkit of a working BI Data Analyst.