Inside the Codecademy Data Scientist: Analytics Specialist Career Path
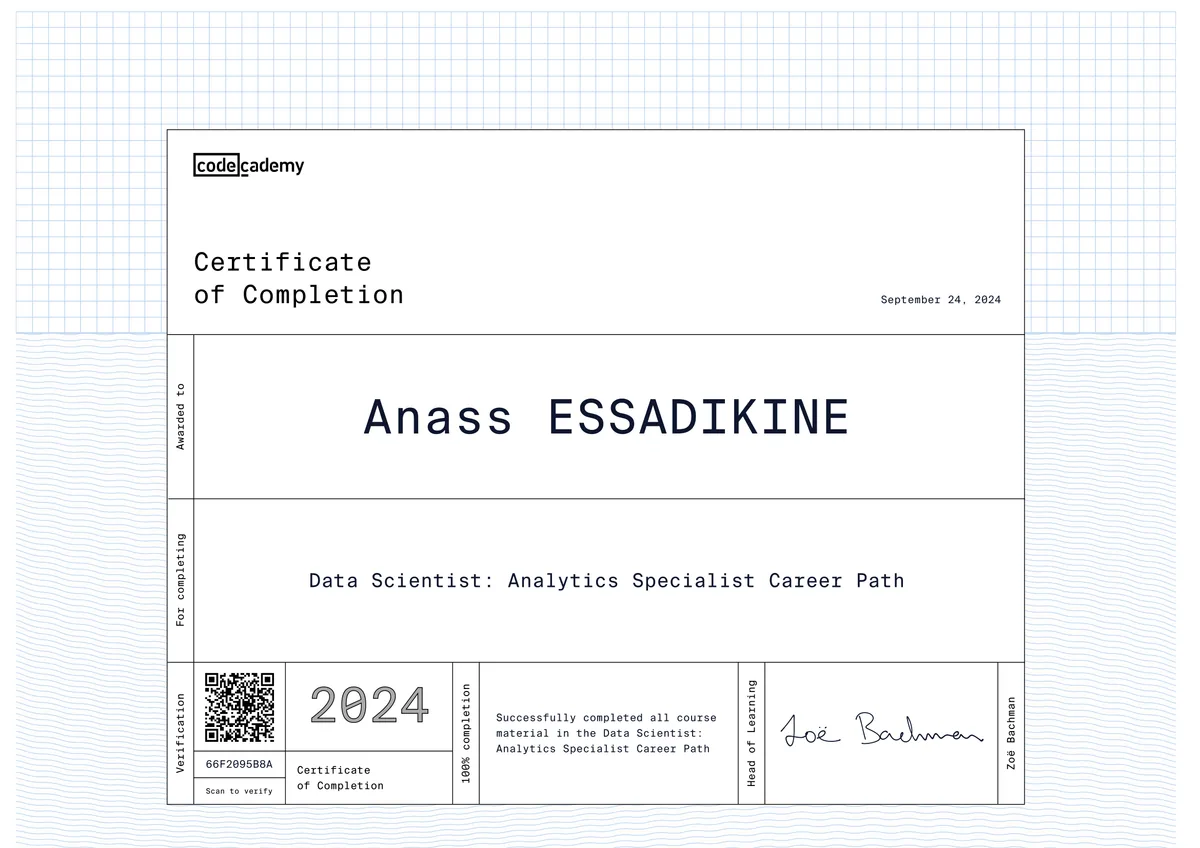
I completed Codecademy's Data Scientist: Analytics Specialist Career Path: 22 modules, roughly 69 lessons, and 57 hands-on projects, about 70 hours of coursework in total. It moves through the analytics workflow in the order it's actually used on the job — query relational data with SQL, clean and reshape it in Python and pandas, apply statistics to find patterns that hold up, then communicate the results through Tableau dashboards and Excel reports. Codecademy only issues the certification after every module assessment and graded project is passed, so it verifies applied ability rather than video-watching.\n\nThat matters because "data analyst" and "data-driven developer" roles increasingly expect the same core toolkit regardless of industry: pull your own data with SQL, don't trust a dataset until it's been cleaned, and know when a chart is honest versus misleading. For a full-stack developer, this credential closes the gap between building the systems that generate data and being able to independently analyze it — the combination enterprises look for when they'd rather hire one person who can ship a feature and then explain what the resulting data means.
What I learned
1Principles of Data Literacy
A conceptual module on data types, data quality, and statistical thinking, including how to spot misleading or confusing graphs before trusting any conclusion drawn from them.
2Learn SQL & Advanced SQL for Data Science
Querying relational databases with joins, aggregate functions, and multi-table queries, extended into window functions and cohort/churn analysis through projects including a Hacker News trends query and a Twitch gaming-data churn calculation.
3Python Fundamentals & Pandas for Data Science
Core Python syntax, control flow, functions, and lists, applied immediately to real datasets in pandas via a U.S. Medical Insurance portfolio project and an A/B testing analysis on an e-commerce dataset.
4Statistics Fundamentals & Exploratory Data Analysis
Probability, sampling distributions, and linear regression fundamentals, put into practice through exploratory data analysis projects diagnosing patterns in a diabetes dataset and analyzing NBA trends.
5Data Wrangling, Cleaning, and Tidying
Handling missing values and standardizing messy, real-world data, practiced on U.S. Census data and the Stack Overflow Developer Survey — the unglamorous but essential majority of analytics work.
6Data Visualization with Python & Tableau
Building charts in Matplotlib and interactive dashboards in Tableau, turning cleaned tables into visuals a non-technical stakeholder can act on, including an NYC census-and-income dashboard.
7Microsoft Excel for Data Analysis
Formulas, pivot tables, and chart-based reporting in Excel, applied to GDP, hotel booking, and Bitcoin price datasets — still the tool most used for reporting inside enterprises.
8Capstone Portfolio Projects
Independent, end-to-end analyses — including a Biodiversity in National Parks study and a final review project — mirroring how a junior analyst turns a raw dataset into a written, stakeholder-ready finding.
Tools & technologies
Applied in my projects
The overlap with my own work is direct: Sales Prediction App with Django & ML uses the exact Python data stack from this path — pandas for cleaning and reshaping sales data, NumPy for numerical operations, and Matplotlib/Seaborn for the visualizations that explain the model's predictions to a non-technical reader. On the database side, University Housing Management (FSBM) required designing and querying a relational MySQL schema — the same relational-thinking and SQL skills this certification formalizes with joins, aggregates, and multi-table queries.
Why this matters for employers
For an employer, this certification is proof I don't need a separate data analyst on the team to make sense of what my own applications produce. I can write the SQL to pull the numbers, clean the dataset in pandas without introducing bias, run the right statistical test instead of eyeballing a trend, and hand back a Tableau dashboard or Excel report a manager can use in a meeting. Paired with my full-stack background, it means I can own a feature from database schema to production deployment to the post-launch analysis of whether it worked, reducing the number of specialists a company needs to hire to reach a data-informed product decision.
Verified certificate
Download the official certificate for this achievement.
Related projects
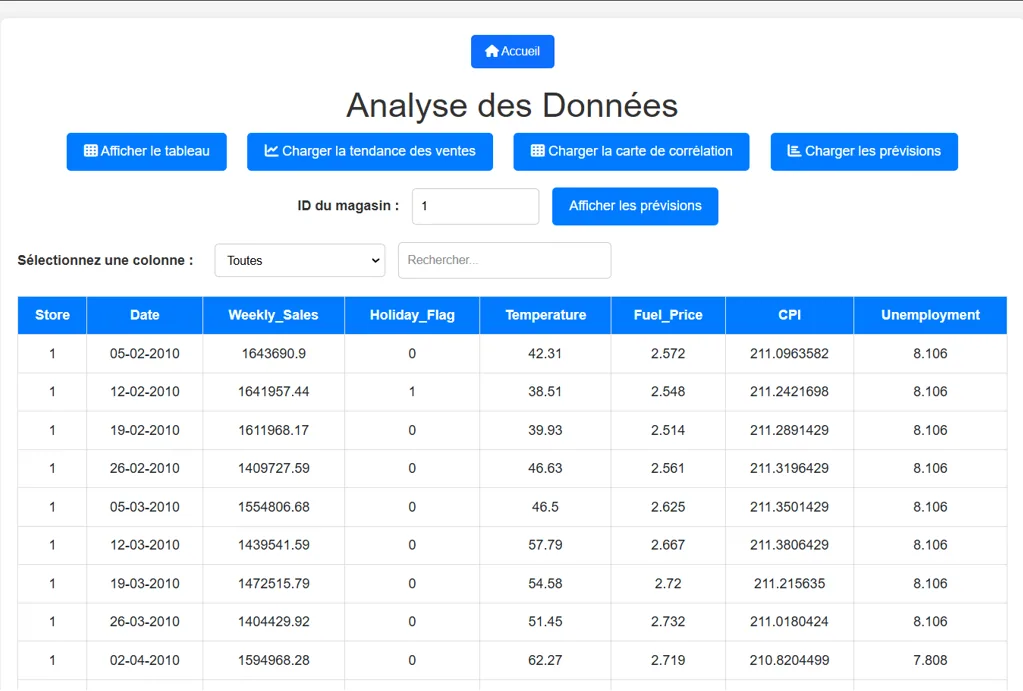 AI / Data Science2024
Sales Prediction App with Django & ML
A predictive analytics web app that forecasts sales and visualizes results through an interactive interface.
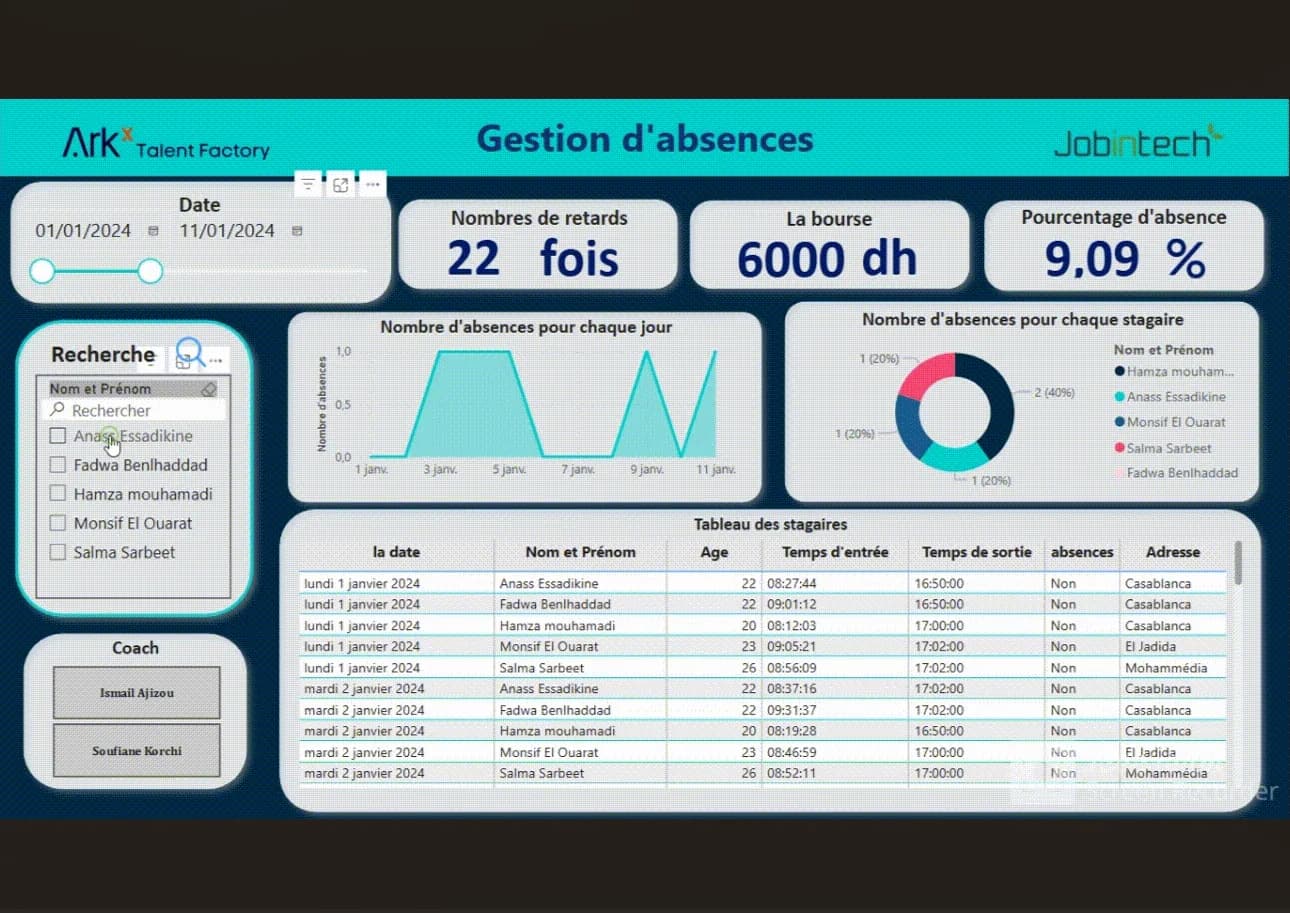 Web Development2024
University Housing Management (FSBM)
A secure platform for managing student housing requests, allocations, and payments end-to-end.
Frequently asked questions
It's a project-based certification track with 22 modules and 57 hands-on projects covering SQL, Python, pandas, statistics, data cleaning, Tableau, and Excel — the full workflow of a data analyst, from querying a database to presenting findings.