Data Quality and Anomaly Detection in Practice
Wrong numbers in a dashboard destroy trust faster than slow reports. Here is the layered approach I use: rules first, statistics second, machine learning only when needed.

Why data quality is a data-engineering problem
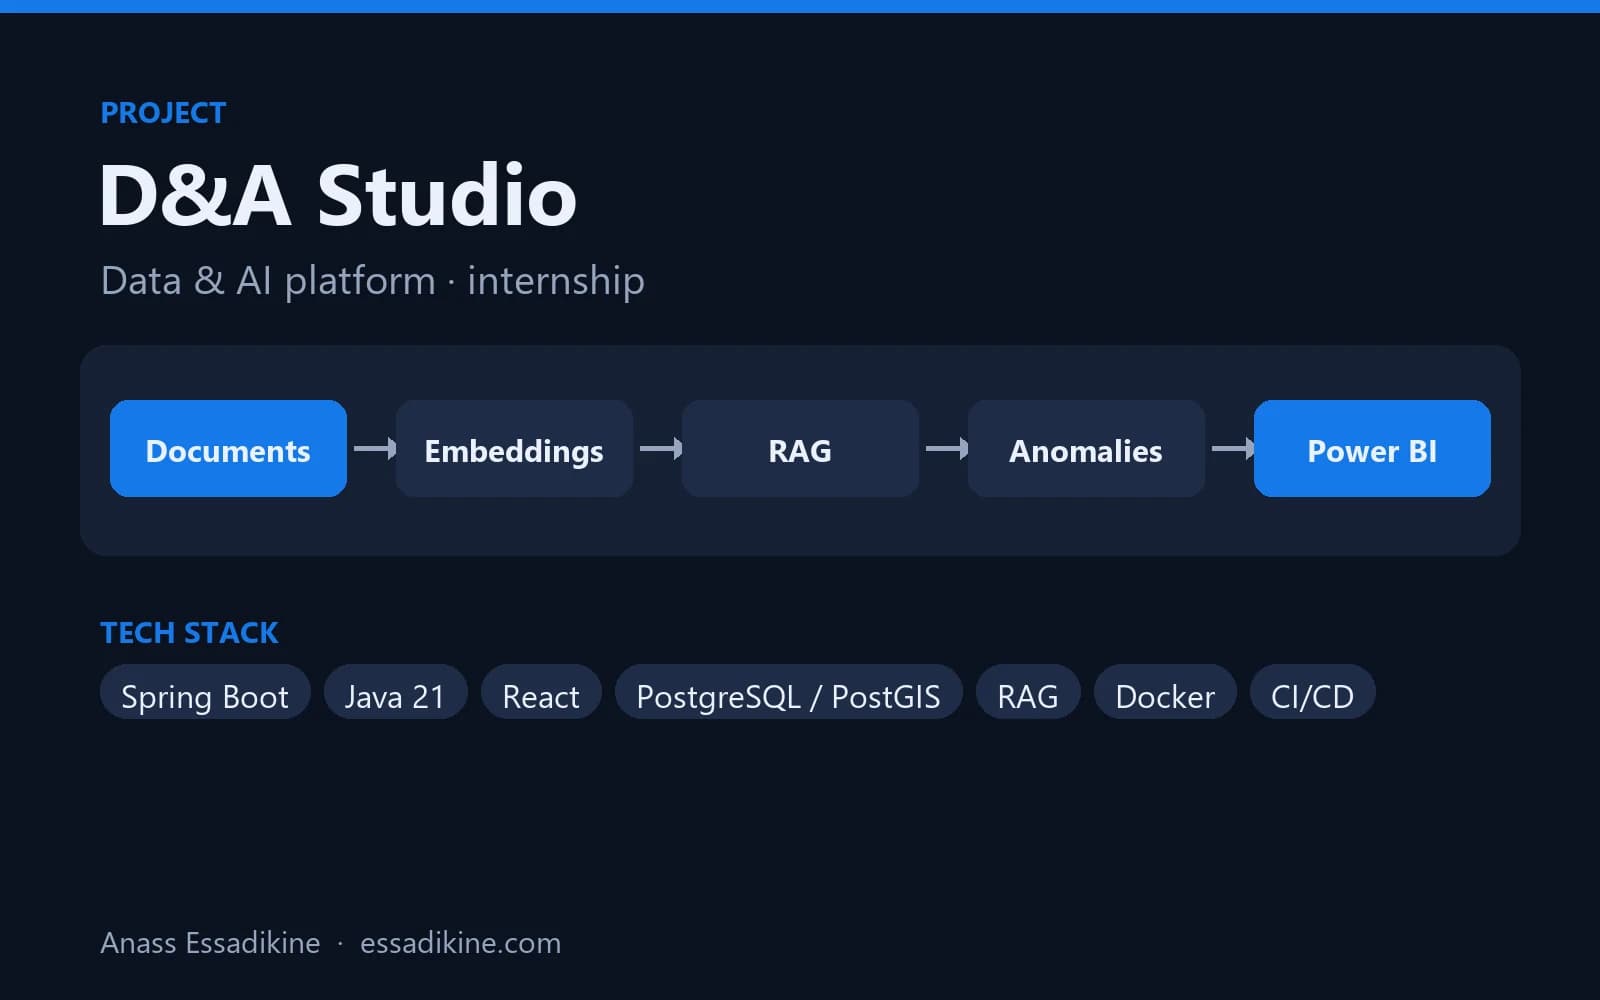
A dashboard that shows a wrong total once loses its users' trust for months. Most errors are not exotic: a duplicated import, a column that changed format, a missing day of data, a sensor that froze. The goal of anomaly detection is to catch these problems before people see them — it is one of the modules I built in D&A Studio.
Layer 1 — Rule-based checks (cheap and essential)
Run these on every load, in SQL or in your pipeline:
| Check | Example rule |
|---|---|
| Completeness | customer_id is never null |
| Uniqueness | no duplicate invoice_id |
| Validity | amount >= 0, dates not in the future |
| Referential integrity | every region_id exists in the region table |
| Freshness | yesterday's data has arrived by 08:00 |
| Volume | row count within ±30 % of the 7-day average |
A uniqueness check is one query:
SELECT invoice_id, COUNT(*) AS n
FROM staging_invoices
GROUP BY invoice_id
HAVING COUNT(*) > 1;
If it returns rows, stop the load or move those rows to a quarantine table.
Layer 2 — Statistical anomaly detection
Rules catch impossible values; statistics catch unusual ones. A robust z-score on a rolling window works well for daily metrics:
import pandas as pd

def flag_anomalies(df: pd.DataFrame, col: str, window: int = 28, threshold: float = 3.5):
    roll = df[col].rolling(window, min_periods=7)
    median = roll.median()
    mad = roll.apply(lambda x: (abs(x - x.median())).median(), raw=False)
    robust_z = 0.6745 * (df[col] - median) / mad.replace(0, float("nan"))
    df["anomaly"] = robust_z.abs() > threshold
    return df
Median and MAD (median absolute deviation) are less sensitive to the outliers you are trying to find than mean and standard deviation.
Layer 3 — Machine learning, when patterns are complex
When anomalies depend on several variables together (time of day, location, amount), an unsupervised model like Isolation Forest is a good start:
from sklearn.ensemble import IsolationForest

features = df[["amount", "hour", "items", "distance_km"]]
model = IsolationForest(contamination=0.01, random_state=42).fit(features)
df["is_anomaly"] = model.predict(features) == -1
Start with rules and statistics. Add a model only when they miss real problems, and always show why a row was flagged.
What happens when a check fails?
Detection is useless without action:
- Block or quarantine — critical checks stop the pipeline.
- Flag — non-critical anomalies are loaded but marked, and dashboards can show a warning.
- Alert an owner — send the failed check, sample rows and a link to a person who can fix the source (email, Teams, Telegram).
- Track — keep a history of checks to see if quality improves.
Practical tip
In practice, many anomalies are not fraud or sensor failures but pipeline problems such as duplicated imports or late files. Freshness and volume checks — the simplest ones — are the first to set up.
Need reliable data pipelines?
I build data pipelines, quality checks and dashboards. See my services or contact me.

Related projects
 AI & AutomationInternship · 2026
D&A Studio — Data & AI Platform (PaaS)
A platform that brings geospatial tracking data, an AI assistant on company documents, anomaly detection and BI dashboards into one place.
 Data Analytics & BIAcademic project · 2025
Decision-Support System for Social Security Data (CNSS)
A star-schema data warehouse fed by ETL flows, with analytics dashboards for decision-makers.
Frequently asked questions
Validation checks fixed rules (not null, unique, within a range). Anomaly detection looks for values that are possible but unusual compared with history. You need both.