Excel for Data Analysis: What Microsoft's Certification Actually Teaches
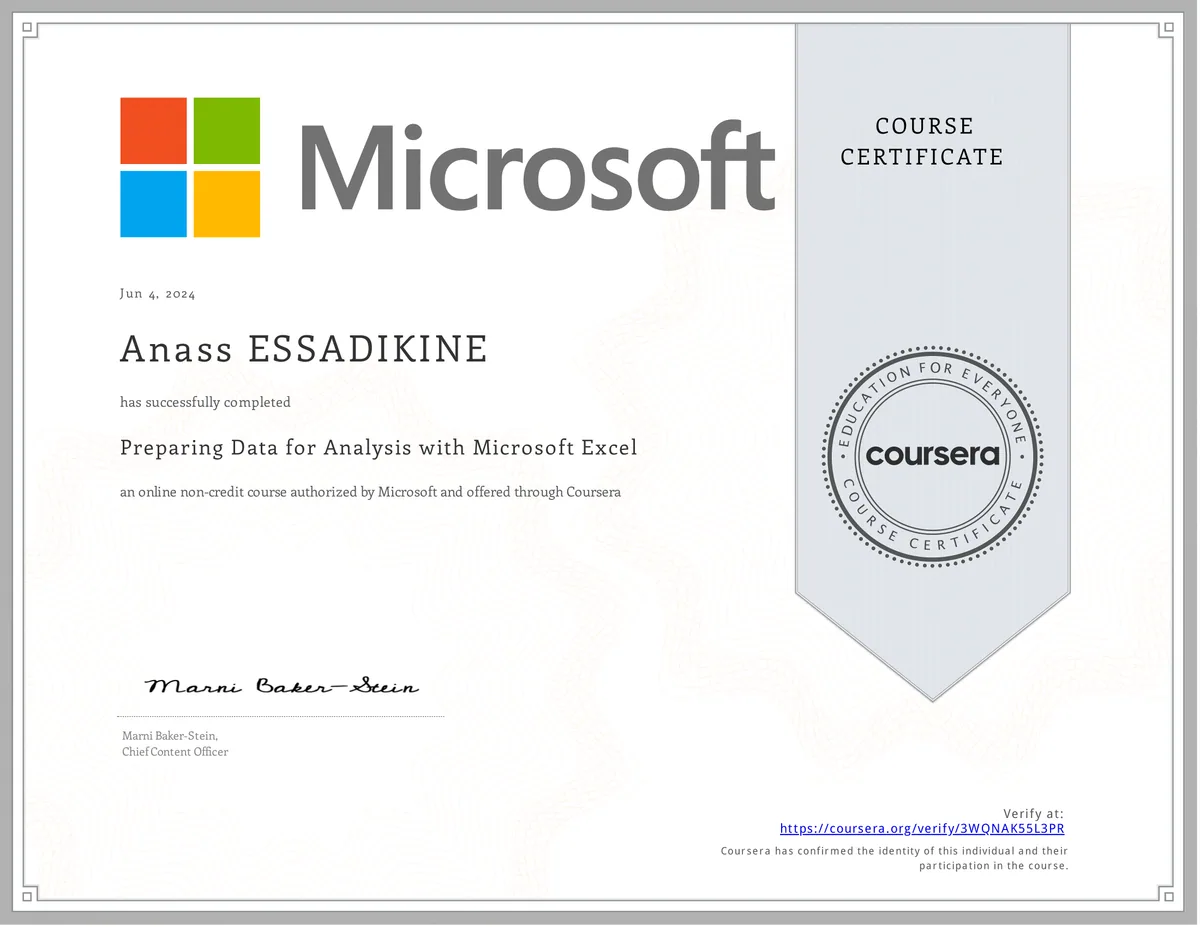
Excel for Data Analysis is a Microsoft-authored course on Coursera, part of Microsoft's Excel and Power BI data-analytics learning path. It teaches one specific, practical skill: turning raw, messy spreadsheet data into something clean, calculated, and ready for reporting or downstream analytics tools.
It matters because Excel is still where most business data starts. Long before a dataset reaches a BI dashboard or a machine-learning model, someone has to structure it, fix inconsistent entries, and build formulas that hold up — and recruiters treat that ability as a baseline signal of data literacy, especially for developers and analysts who get handed business spreadsheets, not clean CSVs.
What I learned
1Excel Fundamentals
Core spreadsheet mechanics: creating and formatting worksheets, entering and organizing data, and navigating larger datasets efficiently with sorting and filtering.
2Formulas and Functions
Building formulas correctly, controlling calculation order with operator precedence, and applying Excel's built-in functions to solve real business calculations.
3Preparing Data for Analysis Using Functions
Cleaning and standardizing data with text functions, performing date and time calculations, and using logical functions (IF, IFS) to generate derived columns ready for analysis.
4Final Project: Executive Data Summary
A scenario-based capstone that transforms a raw dataset into a polished executive summary using the formulas and functions from earlier modules, assessed with a graded project and quiz.
Tools & technologies
Applied in my projects
The data-cleaning discipline this certification teaches — standardizing inconsistent values, deriving new fields with logical functions, and preparing a raw dataset for analysis — carries directly into my Sales Prediction App with Django & ML (sales-prediction-django-ml), where I clean historical sales data with pandas and NumPy before running regression models and building exploratory visualizations with Matplotlib and Seaborn. Whether the tool is an Excel formula or a pandas pipeline, the question is the same: is this data trustworthy enough to base a decision on.
Why this matters for employers
Employers hiring for full-stack, data, or BI-adjacent roles need people who can turn a messy spreadsheet into a decision-ready number without waiting on a data team — this certification is evidence I can do exactly that. It signals practical data literacy: structuring raw data, applying operator precedence and built-in functions correctly, standardizing inconsistent text and date fields, and packaging results into an executive summary a non-technical stakeholder can act on immediately. Paired with my Python/pandas and Django experience, it means I can meet a business where it already works — in Excel — and carry that same rigor into a production analytics stack, which shortens onboarding time and closes the "translation gap" between engineering and business teams.
Related projects
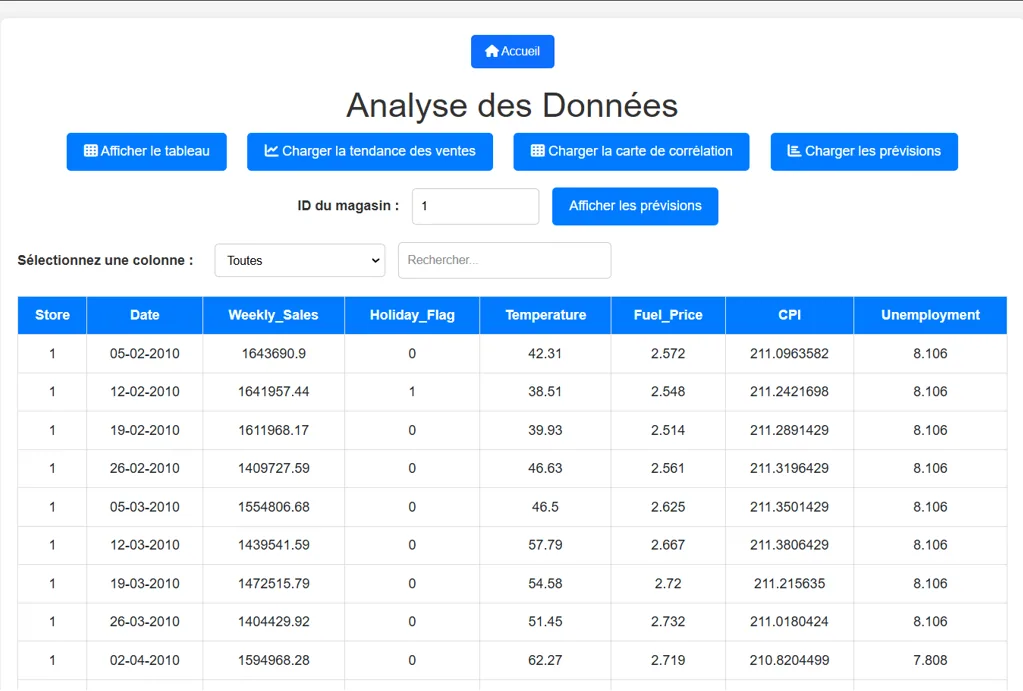 AI / Data Science2024
Sales Prediction App with Django & ML
A predictive analytics web app that forecasts sales and visualizes results through an interactive interface.
Frequently asked questions
It covers Excel fundamentals (worksheet setup, formatting, sorting, filtering), building formulas with correct operator precedence, and using text, date/time, and logical functions (IF, IFS) to clean and standardize data — finished with a capstone that produces an executive data summary.